








Employee turnover rate is the percentage of employees who leave an organization over a defined period, usually a month, quarter, or year. You calculate it by dividing the number of employees who left during the period by the average number of employees on staff during that same period, then multiplying by 100. It's one of the most-watched people metrics because it puts a single number on something expensive and disruptive: people walking out the door and taking their knowledge with them.
The number itself is easy to compute. Reading it correctly is the harder part. A 15% annual turnover rate might be excellent for a retail chain and alarming for a specialized engineering team, so the rate only means something once you know what's leaving, why, and how your figure compares to your own industry.
Key Takeaways
- Turnover rate is separations divided by the average headcount over a period, times 100. It's a percentage, not a raw count.
- Use average headcount (start plus end, divided by two), not the starting or ending number, so growth or shrinkage during the period doesn't distort the rate.
- Voluntary turnover (people who choose to leave) and involuntary turnover (layoffs, terminations) tell you very different things and should be tracked separately.
- There's no universal "good" turnover rate. Industry, role type, and seniority matter far more than any single benchmark figure.
- The rate is a lagging indicator. By the time it moves, the causes have usually been building for months, which is why leading signals like engagement and exit-interview themes matter more than the number alone.
What Is Employee Turnover Rate?
Employee turnover rate measures how many people leave an organization relative to its total workforce over a set window of time. It's expressed as a percentage so that a company of 40 and a company of 4,000 can be compared on the same scale. A 10% annual rate means that, over the year, departures equalled one in ten of the average headcount.
Turnover counts every separation: resignations, retirements, layoffs, and terminations. A closely related metric, attrition, is sometimes used to describe only the departures a company chooses not to backfill, but in everyday HR use the two terms are often treated as interchangeable. What matters is that you define your terms once and apply them consistently, so this quarter's rate can be compared to last quarter's.
The metric earns its attention because turnover is costly in ways that don't show up on a single line item. Recruiting, onboarding, lost productivity while a role sits open, and the ramp-up time before a replacement is fully effective all add up. Tracking the rate over time is how a team catches a retention problem while it's still small enough to do something about.
How to Calculate Turnover Rate
The standard formula is:
Turnover Rate = (Number of separations during the period ÷ Average number of employees during the period) × 100
Average headcount is the starting headcount plus the ending headcount, divided by two. Using the average rather than the start or end figure keeps a company that grew or shrank a lot during the period from producing a misleading rate.
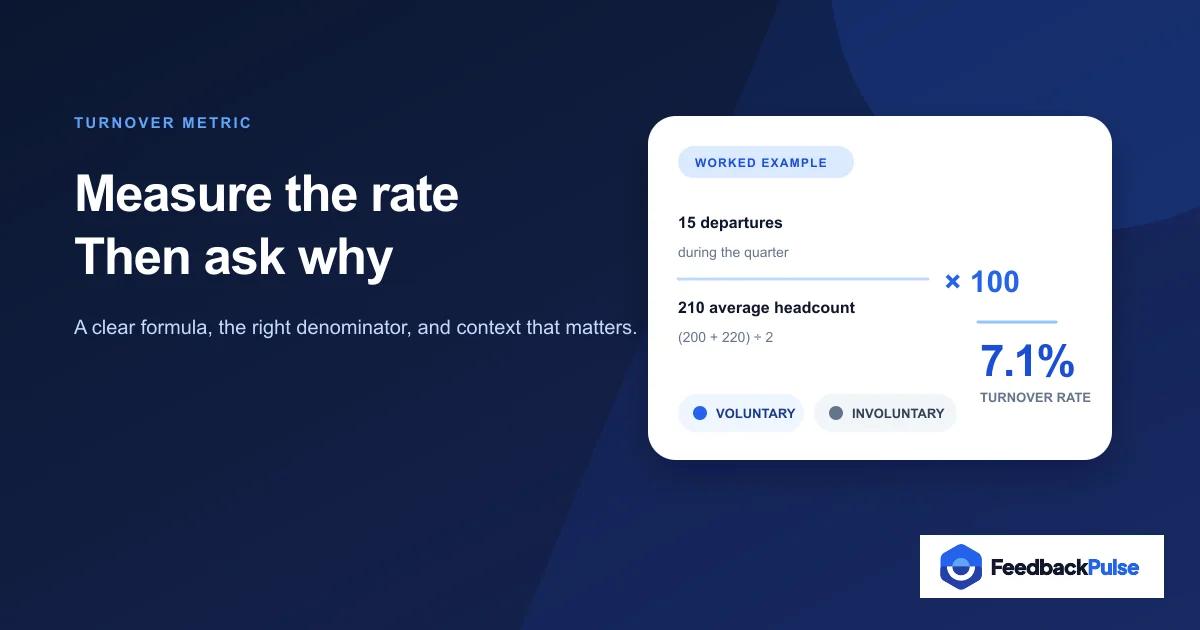
A worked example: a team starts the quarter with 200 employees and ends with 220, so the average headcount is (200 + 220) ÷ 2 = 210. Fifteen people left during the quarter. The turnover rate is 15 ÷ 210 × 100 = 7.1% for the quarter.
Two practical notes. First, pick your period deliberately: a monthly rate is more sensitive and better for spotting sudden changes, while an annual rate smooths out seasonal noise and is easier to benchmark. Second, decide up front whether a given departure counts. Interns rolling off, seasonal staff, and internal transfers can all inflate or distort the number if you're not consistent about how you handle them.
Types of Turnover
A single blended rate hides more than it shows. Breaking it down is where the metric starts to explain itself.
Voluntary turnover covers people who chose to leave, whether for a new job, a career change, or retirement. High voluntary turnover is usually the signal that matters most, because it often points to problems with pay, management, or growth opportunities that the company could have addressed.
Involuntary turnover covers departures the company initiated: layoffs, restructures, and terminations for performance or conduct. A rate that looks high because of a one-time restructure means something completely different from the same rate driven by people quitting.
Regretted vs. non-regretted turnover splits departures by whether you wanted to keep the person. Losing a top performer and parting ways with a poor fit both add to the raw rate, but only one of them is a problem to solve. Tracking regretted turnover separately keeps a healthy pruning of underperformers from masking the loss of people you needed.
New-hire or first-year turnover isolates people who leave within their first year, sometimes within the first 90 days. A high figure here usually points at a hiring, onboarding, or expectation-setting problem rather than a broad retention issue, and it's one of the fastest signals to act on.
What Is a Good Turnover Rate?
There's no universal target, and any source that gives you one flat number is oversimplifying. What counts as healthy depends heavily on your industry, the type of roles involved, and seniority. Hospitality and retail routinely run turnover several times higher than, say, utilities or government, and neither figure is "wrong" for its context.
The right benchmark is your own industry, not a global average. The U.S. Bureau of Labor Statistics publishes separations and quits rates by industry through its Job Openings and Labor Turnover Survey (JOLTS), updated monthly, which is the most reliable public source for a current, industry-specific comparison. Pull the figure for your sector and use that as the reference point rather than a number from a blog post.
Two comparisons usually beat any external benchmark: your rate against your own history, and your voluntary rate specifically against your industry's. A rate that's stable and mostly involuntary is a very different situation from one that's climbing and mostly regretted, even if the headline percentages are identical.
Why Turnover Rate Matters and How to Act on It
The rate is worth tracking, but it's a lagging indicator: by the time it moves, whatever caused it has usually been building for months. That's why the number is a starting point for investigation, not a conclusion. When it rises, the useful question is which segment moved (a team, a tenure band, a manager, a role type), because the answer points at the cause.
The most direct source of "why" is the people who left. Exit interviews surface the recurring themes behind departures, and a pattern across several exits is far more actionable than one resignation letter. To catch problems before they turn into departures, leading signals help most: regular engagement surveys and pulse surveys can flag a drop in sentiment on a team months before anyone quits, and consistent performance conversations tied to retention give managers a chance to address concerns while the person is still in the building.
For the full picture of what drives turnover and the strategies to reduce it, our complete guide to employee turnover goes past the definition into causes, cost modelling, and retention tactics. This page is the measurement primer; that one is the playbook.
Common Mistakes When Measuring Turnover
Using starting or ending headcount instead of the average. In a period of real growth or contraction, the wrong denominator can move the rate by several points. Average headcount is the standard for a reason.
Blending voluntary and involuntary into one number. A rate that spiked because of a layoff and a rate that spiked because people are quitting call for opposite responses. A single figure can't tell you which you're looking at.
Comparing against the wrong benchmark. Measuring your engineering team against a cross-industry average, or against a competitor in a different sector, produces a comparison that feels precise and means nothing. Your own trend line and your specific industry are the honest references.
Treating the rate as the answer instead of the question. The number tells you something changed, not why. Stopping at "turnover is up 3 points" without breaking it down by segment and cause wastes the metric's real value.
Ignoring new-hire turnover inside the blended rate. First-year departures often have a distinct, fixable cause, usually hiring or onboarding, that gets buried when they're pooled with everyone else.
Frequently Asked Questions
What is the formula for turnover rate?
Turnover rate equals the number of separations during a period divided by the average number of employees during that period, multiplied by 100. Average headcount is the starting count plus the ending count, divided by two. For example, 15 departures against an average headcount of 210 gives a 7.1% rate for the period.
What's the difference between turnover and attrition?
In everyday HR usage the terms are often interchangeable, both describing employees leaving over time. Where people do draw a line, attrition tends to mean departures the company deliberately doesn't backfill (natural shrinkage), while turnover covers all separations regardless of whether the role is refilled. The practical advice is the same: define which you mean and apply it consistently.
Is a high turnover rate always bad?
No. Some turnover is healthy, since it opens room for new skills and moves out poor fits. A high rate is a concern mainly when it's voluntary and regretted, meaning people you wanted to keep are choosing to leave. A rate driven by a one-time restructure or by parting ways with underperformers is a different, often less worrying, story.
How often should you measure turnover rate?
Monthly for early warning and quarterly or annually for benchmarking and trend analysis. A monthly view catches sudden shifts fast; an annual view smooths seasonal noise and is easier to compare against industry data. Many teams track both and watch the direction of travel more than any single reading.
What is voluntary versus involuntary turnover?
Voluntary turnover is when the employee chooses to leave, whether by resignation, retirement, or a move elsewhere. Involuntary turnover is when the company initiates the departure, such as a layoff or termination. Separating the two is essential, because they point at completely different causes and call for different responses.
Getting Started
Turnover rate is the number that tells you something is happening; it rarely tells you what. Calculate it consistently, break it into voluntary and involuntary, watch new-hire turnover on its own, and compare against your own history and your specific industry rather than a one-size-fits-all benchmark. Then treat every rise as a prompt to dig into the why. The teams that keep turnover low aren't the ones with the best formula. They're the ones listening closely enough, through exit interviews and regular engagement checks, to act on a problem before it shows up in the percentage.