Survey Results and eNPS Benchmarks
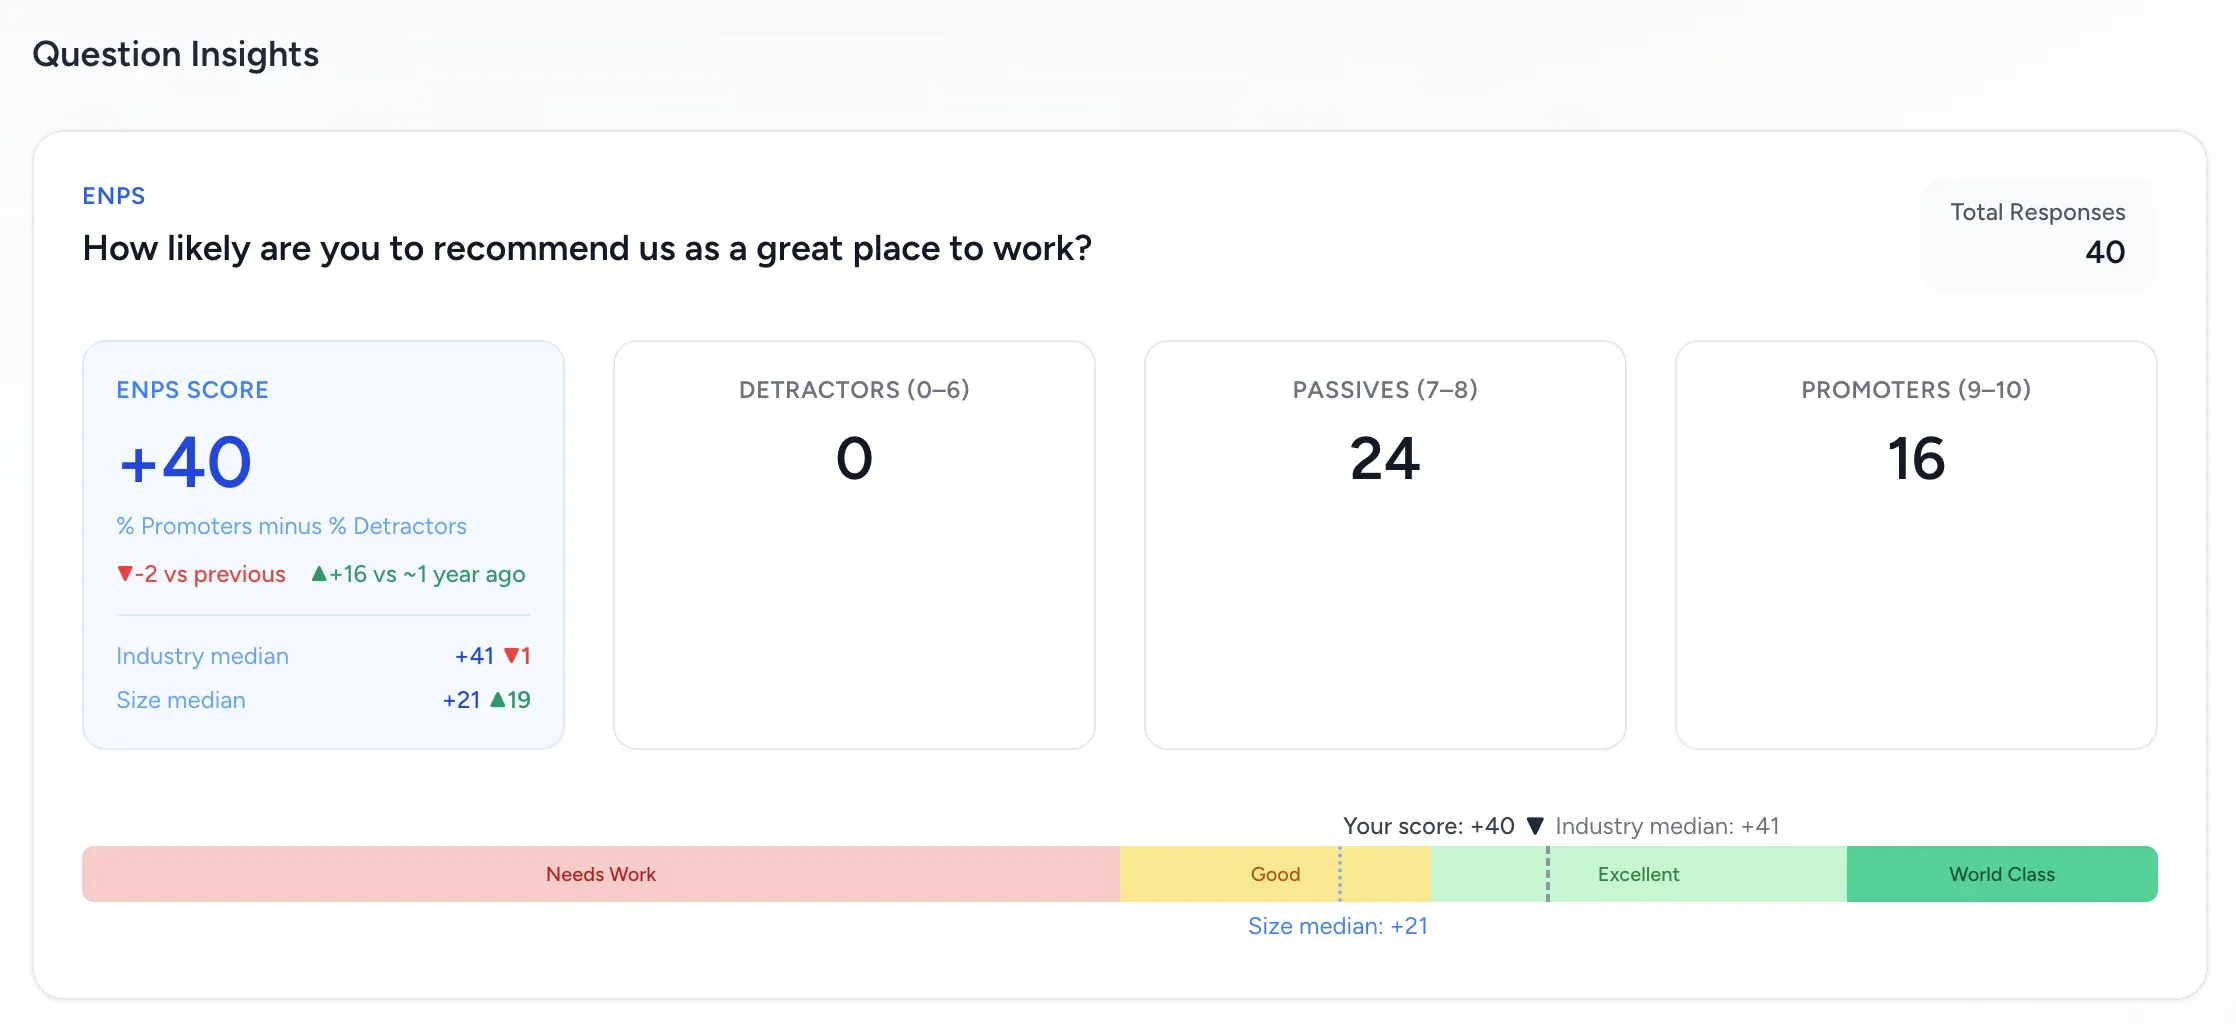
Survey question insights are designed to answer one question quickly: what changed, and where should HR act first? For eNPS questions, FeedbackPulse shows your score, benchmark context, and historical comparison markers in the same card.
Where to find survey results
Section titled “Where to find survey results”- Go to Surveys.
- Open a survey instance.
- Scroll to Survey Results for per-question insights.
For export and sharing workflows, admins can also use the survey report views under Reports.
Who can view survey results
Section titled “Who can view survey results”Survey results are controlled by role and survey ownership, not only by the Manager assigned to the recipients.
| Person | What they can view |
|---|---|
| Admins | Survey results and survey report views for the organization. For Named surveys, admins can open individual responses. For Anonymous surveys, individual respondent identities are hidden. |
| Managers | Survey report aggregates for their reporting line in Reports > Survey Reports. This includes direct and indirect reports, so a Head of Department can see the managers below them and those managers’ teams. |
| Survey recipients | Their own submitted response, not the full results dashboard or other people’s responses. |
For an admin-launched recurring survey sent to all team members, responses are not visible to the whole team. Employees can open their own submitted response. Managers, Heads of Department, and senior leaders see the survey report scoped to the people below them in the reporting line.
If the survey is Anonymous, report viewers see aggregate results only after privacy thresholds are met. If the survey is Named, admins can connect individual responses to respondents. Manager reporting-line views are designed for aggregates and trends, not broad access to every person’s individual response.
How reporting-line visibility works for weekly surveys
Section titled “How reporting-line visibility works for weekly surveys”Reporting-line visibility is automatic once the correct Reports to relationships are set in the team profile data. You do not need to create a separate share link for each manager just to let them see their own reporting-line survey report.
| Viewer | Survey report scope |
|---|---|
| Employee | Their own submitted response |
| Manager | Their direct and indirect reports |
| Head of Department | The managers below them and those managers’ reporting lines |
| CEO or senior leader | Everyone below them in the reporting line |
Managers and leaders should go to Reports > Survey Reports. Their report scope is locked to Your reporting line, so they cannot switch into another manager’s team or the whole-company report unless they also have Admin access.
Survey reports include completed or expired survey instances. If everyone responds before the survey window ends, the survey can complete early; otherwise, the report becomes available after the scheduled end time.
What each question card shows
Section titled “What each question card shows”Every question card includes:
- The question text and type.
- Total Responses for that question.
- A question-type specific breakdown:
- Likert: average score and distribution.
- Yes/No: count and percentage split.
- Text: written responses (with anonymity protections).
- eNPS: score, promoter/passive/detractor split, benchmark context, and historical deltas.
How eNPS is calculated
Section titled “How eNPS is calculated”FeedbackPulse uses the standard eNPS model:
| Group | Rating range |
|---|---|
| Detractors | 0 to 6 |
| Passives | 7 to 8 |
| Promoters | 9 to 10 |
Formula:
$$ \text{eNPS} = %\text{Promoters} - %\text{Detractors} $$
This is why you can see negative scores as well as positive scores.
How to read the benchmark strip
Section titled “How to read the benchmark strip”For eNPS questions, the benchmark strip uses four zones:
| Zone | eNPS range |
|---|---|
| Needs Work | -100 to 0 |
| Good | 0 to 30 |
| Excellent | 30 to 70 |
| World Class | 70 to 100 |
The strip also shows reference markers:
- Your score marker (current survey).
- Industry median marker (or Global median if industry is not set).
- Size median marker when company-size benchmark data is available.
Industry and size medians
Section titled “Industry and size medians”Industry median
Section titled “Industry median”- If your company industry is set, FeedbackPulse uses that industry benchmark.
- If industry is not set (or maps to an unsupported benchmark), FeedbackPulse falls back to a global cross-industry median.
- Benchmark ranges are shown only when a low/high range is meaningful.
Size median
Section titled “Size median”Size median is mapped from company size bands:
1-10,11-50,51-200-> 0-250 band201-500-> 251-500 band500+-> 501-1000 band
If company size is not configured, FeedbackPulse infers the size band from active employee count.
Trend markers: vs previous and vs ~1 year ago
Section titled “Trend markers: vs previous and vs ~1 year ago”When comparison data exists, eNPS cards show two trend markers:
- vs previous
- vs ~1 year ago
Each marker shows:
▲+Nwhen the current score is higher▼-Nwhen the current score is lower=when unchanged
If comparison data is unavailable, the UI shows:
no previous datano prior year data
How comparison surveys are selected
Section titled “How comparison surveys are selected”FeedbackPulse compares against surveys that match all of these rules:
- Same survey template.
- Same tenant.
- Status is
completedorexpired. - Not the current survey.
- Not a master recurring template survey.
Selection logic:
- Previous: most recent qualifying survey before the current launch date.
- ~1 year ago: qualifying survey with launch date closest to 12 months before the current launch date.
Privacy and filtering rules that affect results
Section titled “Privacy and filtering rules that affect results”- For anonymous surveys, results are hidden until the minimum anonymity threshold is met (3 completed responses).
- Department and employee-level filters recalculate visible aggregates based on the filtered audience.
- In shared reports, text responses can be withheld when anonymity thresholds are not met.
Can I change the minimum number of responses for anonymous results?
Section titled “Can I change the minimum number of responses for anonymous results?”No. The minimum threshold for anonymous survey results is fixed at 3 completed responses to protect respondent anonymity.
If you need to review results from a smaller group, create the survey as Named instead of Anonymous. Named surveys do not use the anonymous-results threshold, but individual responses can be connected to respondents.
Practical interpretation workflow for HR managers
Section titled “Practical interpretation workflow for HR managers”- Start with Total Responses and response rate context.
- Check eNPS score and zone placement.
- Compare against industry/global and size medians.
- Read vs previous and vs ~1 year ago together before acting.
- Use text responses for explanation, but only after confirming sample size is reliable.
If you are reviewing recurring pulse surveys, this sequence helps separate real sentiment shifts from normal month-to-month variance.