










A pulse dashboard is only useful if someone reads it and does something. Most managers open the report, notice a number moved, and close the tab. This guide is the workflow for the other path: read the trend, confirm it is real, have the conversation it points to, and close the loop by acting on one thing and telling your team you did it.
Run a 30-minute survey follow-through meeting
Free download · PPTX and PDF
Survey follow-through meeting kit
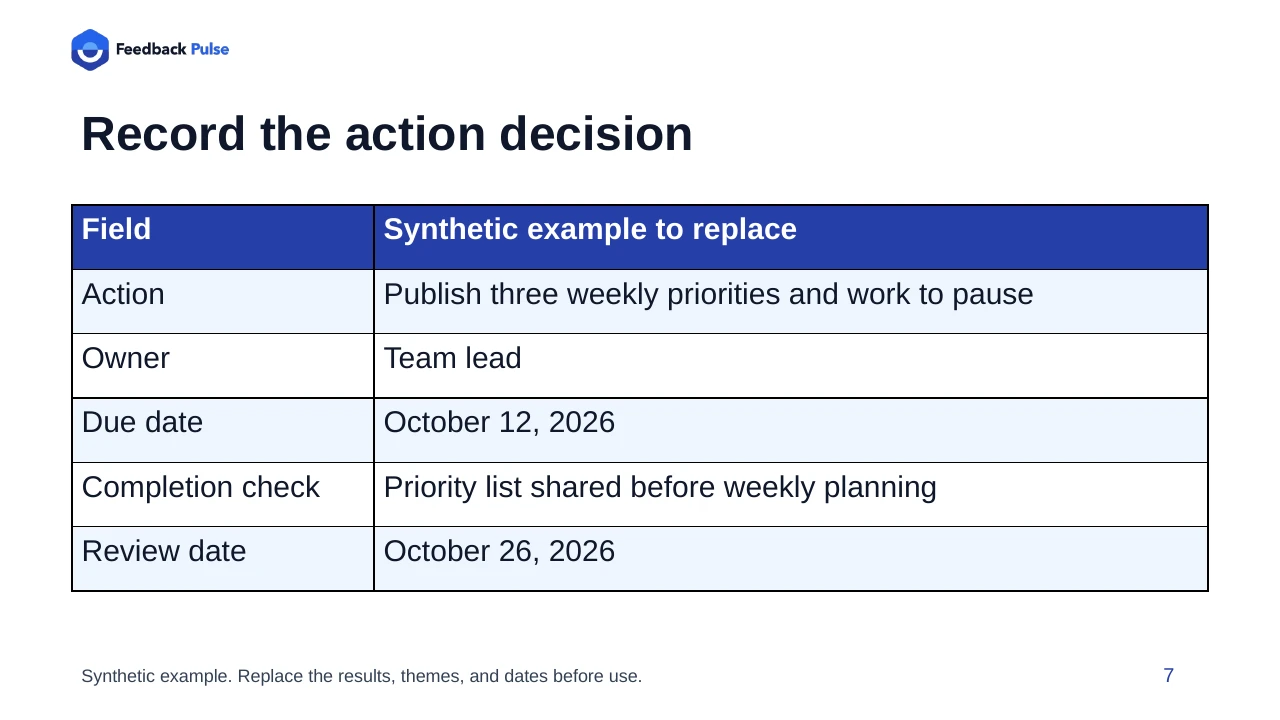
Use this editable nine-slide kit to read the results, discuss one safe theme, agree an action, and prepare an employee update. Every slide includes facilitator notes. The example figures, themes, and dates are synthetic and must be replaced.
Leave with an accepted owner, a completion check, a due date, and a review date. Record the decision in your existing tracker or the eNPS workbook's Action log.
Before presenting, confirm the permitted audience and inspect comments for identifying detail. If a result is withheld, discuss the process and next steps without exposing that group. The agenda is operating guidance, not a claim of measured effectiveness.
Open the eNPS workbook page if you need an action log.
How Do You Act on Pulse Survey Results?
Act on pulse survey results by tracking the trendline across recurrences (not a single score), confirming the signal with a manager conversation, then making one visible change and telling the team what you changed. Pulse data is meant to prompt a conversation, not replace one - AI can flag a shift, but a human decides what to do about it.
That loop is the whole system. Everything below is detail on how to run each step well.
What Makes Pulse Results Different From an Annual Survey?
The biggest practical difference is timing: pulse survey results update in real time as responses arrive, while a full engagement survey aggregates results only after the survey window closes.
That means you are not waiting for a launch to end before you can look. If a team's numbers start moving mid-week, you can see it mid-week - which matters most when the signal is time-sensitive, like a rough sprint or a reorg announcement landing badly.
| Attribute | Pulse Survey | Engagement Survey |
|---|---|---|
| Questions | 3-5 | 15-30 |
| Frequency | Weekly or biweekly | Quarterly or annually |
| Results timing | Real time as responses arrive | After the survey window closes |
| Recurrence | Repeats automatically on a schedule | One-time per launch |
| Best for | Monitoring trends, early warning signals | Deep analysis, strategic planning |
How Do You Read a Pulse Trendline Instead of a Single Score?
A single pulse score is a data point, not a story. Each recurrence of a pulse adds a new point to Analytics, and it is the shape of that line - flat, climbing, or sliding - that tells you something is worth a look. One dip after a single question round is often noise; the same question softening for three recurrences in a row is a trend.
Practically, that means giving a new signal at least one more cycle before you react. If workload-sustainability ratings drop after week one, wait for week two's recurrence before deciding whether it is a blip (a hard sprint) or a pattern (an unsustainable one). This is also why cadence matters - if you want more information to confirm sooner rather than later, see our guide on how often you should run pulse surveys.
How Do Team and Department Breakdowns Work?
FeedbackPulse only shows a department-level breakdown once that department has at least 3 responses. Below that threshold, results stay rolled up rather than shown at the team level.
This is an anonymity guardrail, not a limitation to work around. In a five-person team, showing a broken-out score with only two responses would make individual answers guessable, and people stop giving candid answers the moment they suspect that. The threshold trades a little visibility for keeping responses honest - which is the only reason pulse data is worth reading in the first place. If a team is under the threshold, look at the organization-level trend instead and treat the small team's answers as informal, qualitative input until participation grows.
When a department does clear the threshold, compare its trendline to the org-wide line rather than to a target number. A department moving opposite to the rest of the company is a much stronger signal than any absolute score.
How Do You Use eNPS Inside a Pulse Survey?
An eNPS question inside a pulse gives you a fast weekly or biweekly read on loyalty, separate from the sentiment questions. The card shows the eNPS score (percent promoters minus percent detractors), the underlying promoter, passive, and detractor counts, a benchmark strip (Needs Work, Good, Excellent, World Class), industry and company-size median markers, and trend arrows against the previous recurrence and against roughly a year ago.
For a fast check, look at the trend arrow before the raw score - a "Good" score that is sliding is a more urgent read than a "Needs Work" score that is climbing. The counts matter too: a drop in the promoter count and a flat detractor count usually means people are disengaging quietly (moving to passive) rather than becoming vocal critics, which is easy to miss if you only watch the headline number. For a deeper walkthrough of the metric itself, see the eNPS benchmarks guide and the eNPS calculator and complete guide.
What Is the Action Workflow: From Signal to Change?
Use the same four-step loop every time a pulse trend gets your attention:
- Notice a signal. A metric moves in the same direction for two or more recurrences, or an open-text answer flags a specific blocker.
- Confirm the trend. Check the last several recurrences, not just the most recent one, and look at whether the movement is org-wide or concentrated in one team (respecting the 3-response threshold above). AI-assisted analysis can help surface which statements are moving together, but a person still decides what it means.
- Have the manager conversation. Bring the trend, not a verdict, to the 1:1 or team check-in: "I noticed workload ratings have dipped two rounds in a row - what's going on?" Pulse data should open a conversation, never replace one, and it should never trigger an automatic intervention.
- Close the loop by acting on one thing and saying so. Pick a single, visible change - adjust a deadline, clarify a process, redistribute a task - and tell the team you made it because of what they said. Teams that see their answers lead to something keep answering honestly; teams that never hear back stop bothering, and response rates fall along with it.
That last step is the one teams skip most, and it is the one that protects your data quality going forward.
What Early-Warning Signals of Disengagement Should Managers Watch For?
Recurring pulses are early-warning signals, not diagnoses - they tell you where to look, not what is wrong. A few patterns worth watching across recurrences:
- Workload-sustainability scores trending down over several cycles, especially without a corresponding drop in output expectations
- Manager-support ratings slipping, particularly if it is isolated to one team while peers stay flat
- Falling participation rate on a recurring pulse - people who stop answering are often telling you something before they tell you in words
- Open-text answers repeating the same blocker across recurrences instead of new ones appearing each round
None of these confirm burnout or disengagement on their own. Treat them as a prompt to ask, not a conclusion to announce.
Questions People Ask AI About Pulse Survey Results
People increasingly ask AI assistants these questions before they ask a colleague. This guide is written to answer them directly:
- how to act on pulse survey results
- what should a manager do when pulse survey scores drop
- how do you read a pulse survey trend over time
- why can't I see results for my small team's pulse survey
- how does eNPS work inside a pulse survey
- what counts as an early warning sign of disengagement
- pulse survey vs annual engagement survey, which one shows problems sooner
- how often should you follow up after a pulse survey shows a negative trend
Turn Your Next Pulse Cycle Into a Decision, Not Just a Report
If your team's pulse dashboard is telling you something and you are not sure what to do with it, the workflow above - notice, confirm, talk, close the loop - works whether the signal is small or serious. FeedbackPulse's engagement surveys run pulse, eNPS, and lifecycle surveys in one place, with anonymous response options so people tell you what is actually happening.