Segment Survey Results and Read Department Heatmaps
Use Reports → Surveys to compare results for an employee group, review department eNPS over time, and choose a question to explore with your team. Select a survey template, period, and group, then check the response counts before interpreting the scores.
This guide is for HR admins. Examples use the fictional Vellum organization and synthetic survey responses.
Filter results to an employee group
Section titled “Filter results to an employee group”Keep the template and period unchanged when comparing groups.
- Open Reports → Surveys.
- Set Template to the survey you want to review, such as Employee Engagement.
- Set Period to a range containing the survey waves you need, such as Past 12 months.
- In Scope, choose a group, such as Asia under Region. Available choices depend on your organization’s employee data.
- Review the question results and Survey records for that scope. Check the wave name and response count before comparing it with another group.
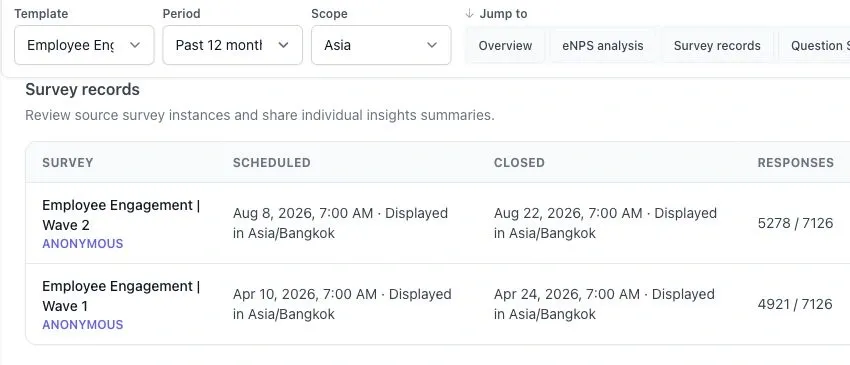
With Asia selected, August Wave 2 shows 5,278 completed responses out of 7,126 invited. Under All-response trends over time, the August result for “My workload is manageable during a typical week” shows 15% favorable in Asia and 33% favorable with Americas selected. Each percentage uses the answers to that question in the selected group and wave.
Check the survey date in the trend before comparing it with a period total. When you open an individual survey, check the filters on that page as well.
To return to the organization-wide report, set Scope to All responses.
Compare departments in the eNPS heatmap
Section titled “Compare departments in the eNPS heatmap”The Department eNPS breakdown is a heatmap within the survey report. It compares departments across survey dates for the same eNPS question.
- Keep the same Template and choose a Period containing at least two reportable survey waves.
- Set Scope to All responses to clear organization filters.
- Go to eNPS analysis and find Department eNPS breakdown.
- Read across a department’s row to compare its score and answer count between dates.
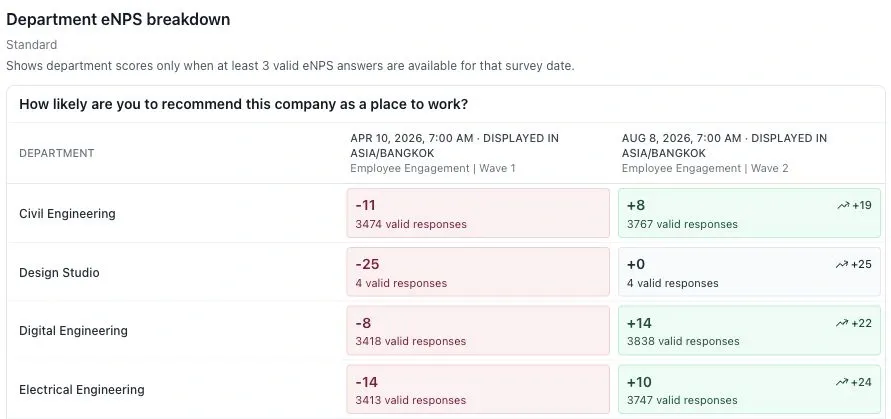
In this example, Civil Engineering moves from −11 to +8, a change of 19 eNPS points. The two scores use 3,474 and 3,767 valid eNPS answers, respectively.
| What you see | How to read it |
|---|---|
| A signed score | The department’s eNPS for that question and survey date. It is not a favorable-answer percentage. |
| Red, neutral gray, or green shading | Negative, zero, or positive eNPS. Stronger shading marks scores at or below −50 or at or above +50. Read the number as well as the color. |
| Response count | Valid eNPS answers used for that cell, not the number invited. |
| An arrow and change value | Change in eNPS points from that department’s previous available cell. |
| A lock and Withheld | Privacy protection prevents the score from being shown. Do not treat it as zero or try to infer it. |
| A dash | No score is available for that department and date. It is not a zero score. |
The breakdown shows the minimum answer count and the scoring method. Use the same method for both scores. See Survey Results and eNPS Benchmarks.
A change is a reason to investigate. Color and movement alone do not establish statistical significance or explain why employees answered differently.
Identify what to investigate next
Section titled “Identify what to investigate next”Use scores to find a concern, then read the comments or saved survey summary for possible explanations.
- Open the relevant completed survey, such as Employee Engagement | Wave 2.
- Review its factor results and the underlying question wording. If a workload question scores poorly, check how many answers support that result.
- Read the available written responses and saved summary. Look for recurring concerns, such as overlapping deadlines or meeting pressure, and check that the comments support the summary.
- Choose a follow-up question. For example, ask “Which recurring deadlines are hardest to meet within your normal working hours?”
- Agree on an action to test, then revisit the same question and group in a later survey. See Action Planning for the next steps.
Factor cards count Likert answers of 4 or 5 as favorable. Their percentage uses valid answers to the factor’s questions as the denominator. A factor with several questions can include several answers from one respondent, so its answer count is not a headcount.
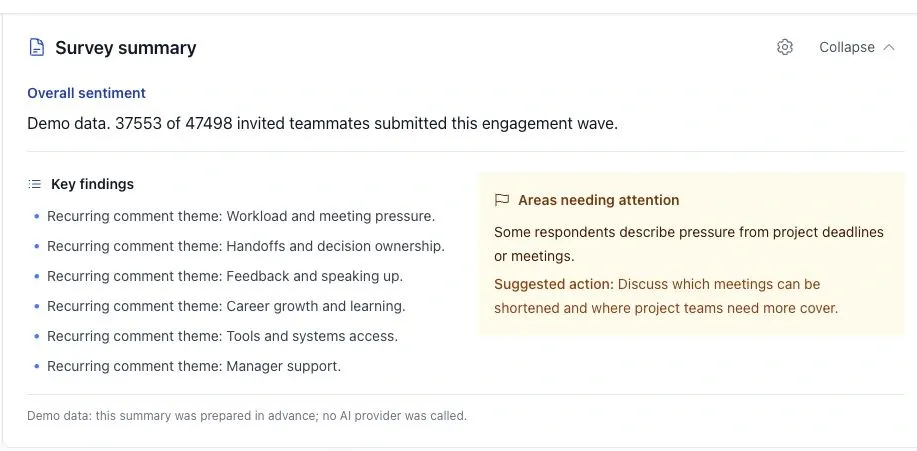
In the company-wide Wave 2 results, 31% of the 37,553 answers to the workload question are favorable. The saved Survey summary flags deadline and meeting pressure. Use that theme to decide what to ask employees next. To investigate Asia specifically, check comments for that group where available.
A low score and recurring comments help you form a question to investigate. They do not prove that workload caused an engagement change. The survey summary provides qualitative findings and suggested actions; it does not rank questions by their statistical relationship to engagement.
For report sections and sharing options, see the Survey Insights Report. For other report types, see Analytics and Reports.